Alpha Generation, Betting Discipline, and Portfolio Construction
A Framework for Understanding Single Managers and Pod Shops
Finding an edge is only half the job. The rest is deciding how much risk it deserves.
This paper develops a framework for evaluating single managers, concentrated funds, and multi-manager platforms. Its central argument is that a real but modest advantage can be destroyed by the way a portfolio is built.
In this paper
The Argument in Four Points
- Modest edges are normal; overbetting is the central failure this paper examines. A useful advantage can be small enough that an oversized bet destroys its value. The examples below use 52 to 53 percent win probabilities in a simple even-money game. Fractional Kelly produces small stakes in that game. Those stakes illustrate the sizing problem; they are not a formula for stock weights or a measured estimate of how much managers overbet. The thesis is that investors too often size modest edges as if they were large ones.
- Concentration requires an advantage large enough to support the risk. Buffett's roughly 40 percent American Express position was held in Buffett Partnership Ltd. It was a specific investment, not a demonstration that 40 percent was mathematically optimal. Berkshire's later insurance float is a separate capital-structure advantage. Copying a famous position size tells us nothing about whether today's opportunity has the same economics. Survivorship bias makes the strategy look smarter than it is.
- High-conviction concentrated funds can be correlated factor bets in disguise. Five managers can have five different stated philosophies—"disruptive innovation," "quality growth," "private equity in public markets," "thematic compounders"—while holding much the same risks. Different stories, same factor exposure. They can look brilliant together when their factor is in favor and fall together when it isn't.
- Alpha shifts from selection to construction. The structural answer—whether through pod shops, systematic single-fund approaches, or other forms—is to separate selection from sizing, enforce systematic position weights, and apply hedges that neutralize unintended exposures. The marginal alpha in disciplined approaches is extracted by aggregation, optimization, and decay detection—not by picking individual winners. The structural premium is real but smaller after frictions (cost drag, crowding, turnover) than the theoretical case suggests.
A Note on Terminology and Mathematical Rigor
Before proceeding, a clarification about how this memo uses the word "edge."
In casual usage, "edge" often means win rate above 50 percent. The Kelly examples in this memo use that binary, even-money framework because it is pedagogically clean—a 52 percent win rate gives an intuitive sense of what a "modest edge" looks like. But this framework is a simplification, and readers familiar with portfolio mathematics will recognize that equities do not produce binary even-money outcomes.
The proper formulation for continuous returns, under log-normal assumptions, gives Kelly-optimal leverage as:
f* = μ / σ²
or equivalently f* = SR / σ, where μ is the expected excess return, σ is volatility, and SR is the Sharpe ratio. At the position level inside a portfolio, the relevant measure of edge is not "win rate" but the information ratio—alpha divided by tracking error—and individual position weights are determined by mean-variance optimization with appropriate risk constraints, not by a simple per-bet Kelly fraction. Asymmetric payoffs (deep value, distressed, special situations, spinoffs) further break the even-money assumption: a position with limited downside and high carry can justify larger weight even at modest hit rates.
When this memo says "edge," it means expected value—a probabilistic advantage that combines direction, magnitude, and payoff asymmetry. The win-rate examples should be read as illustrations of how modest such edges typically are in modern public equity markets, not as literal claims about how Kelly is computed for a stock portfolio.
There is no unique conversion from a win rate to an information ratio or a stock weight. The numerical examples are working illustrations, not estimates from an industry-wide dataset. A stock portfolio requires forecasts of payoffs, volatility, correlations, trading costs, liquidity, and financing. The graphics below are modeled examples, not fund returns.
It is also worth stating up front that real-world applications violate Kelly's clean assumptions. Edges are non-stationary. Payoffs are skewed. Correlations are unstable and spike during stress. This means even fractional Kelly should be treated as an upper bound rather than a target—a ceiling that prudent practice generally stays well below.
Alpha, Edge, and the Kelly Criterion: Foundational Concepts
The Nature of Alpha
Alpha generation begins with identifying a genuine edge—a probabilistic advantage in expected value. This edge manifests in various forms: idiosyncratic company insights (competitive moats, capital allocation skill, financial deterioration), macro forecasts (economic cycles, commodity prices, sector rotation), or systematic factor patterns. The critical insight is that these edges are not all created equal, and most are much weaker than their practitioners believe.
Consider a fundamental analyst who genuinely has skill in identifying undervalued companies with durable competitive advantages. The starting assumption in this paper is that the analyst's advantage in widely followed public markets is modest. A stylized even-money game with a win probability between 51 and 55 percent makes that point easy to see. These are assumed probabilities for an illustration, not measured stock-picking success rates. An information ratio measures expected active return relative to tracking error; it cannot be inferred from those win probabilities alone.
This small edge, properly sized and diversified, compounds into meaningful alpha over time through the magic of large numbers and portfolio construction. The problem is that most investors conflate having an edge with the magnitude of that edge. They observe their own conviction and backtest results and assume they should size positions accordingly. They imagine their edge is 60 or 65 percent when in reality it is 52 or 53 percent. This estimation error leads directly to overbetting.
The Kelly Criterion and Fractional Sizing
The Kelly criterion provides the mathematical framework for optimal bet sizing. In its purest form, it answers the question: given your true edge, what fraction of your capital should you risk on each bet to maximize long-term geometric growth?
For symmetric (even-money) payoffs, the Kelly fraction is:
f* = 2p − 1
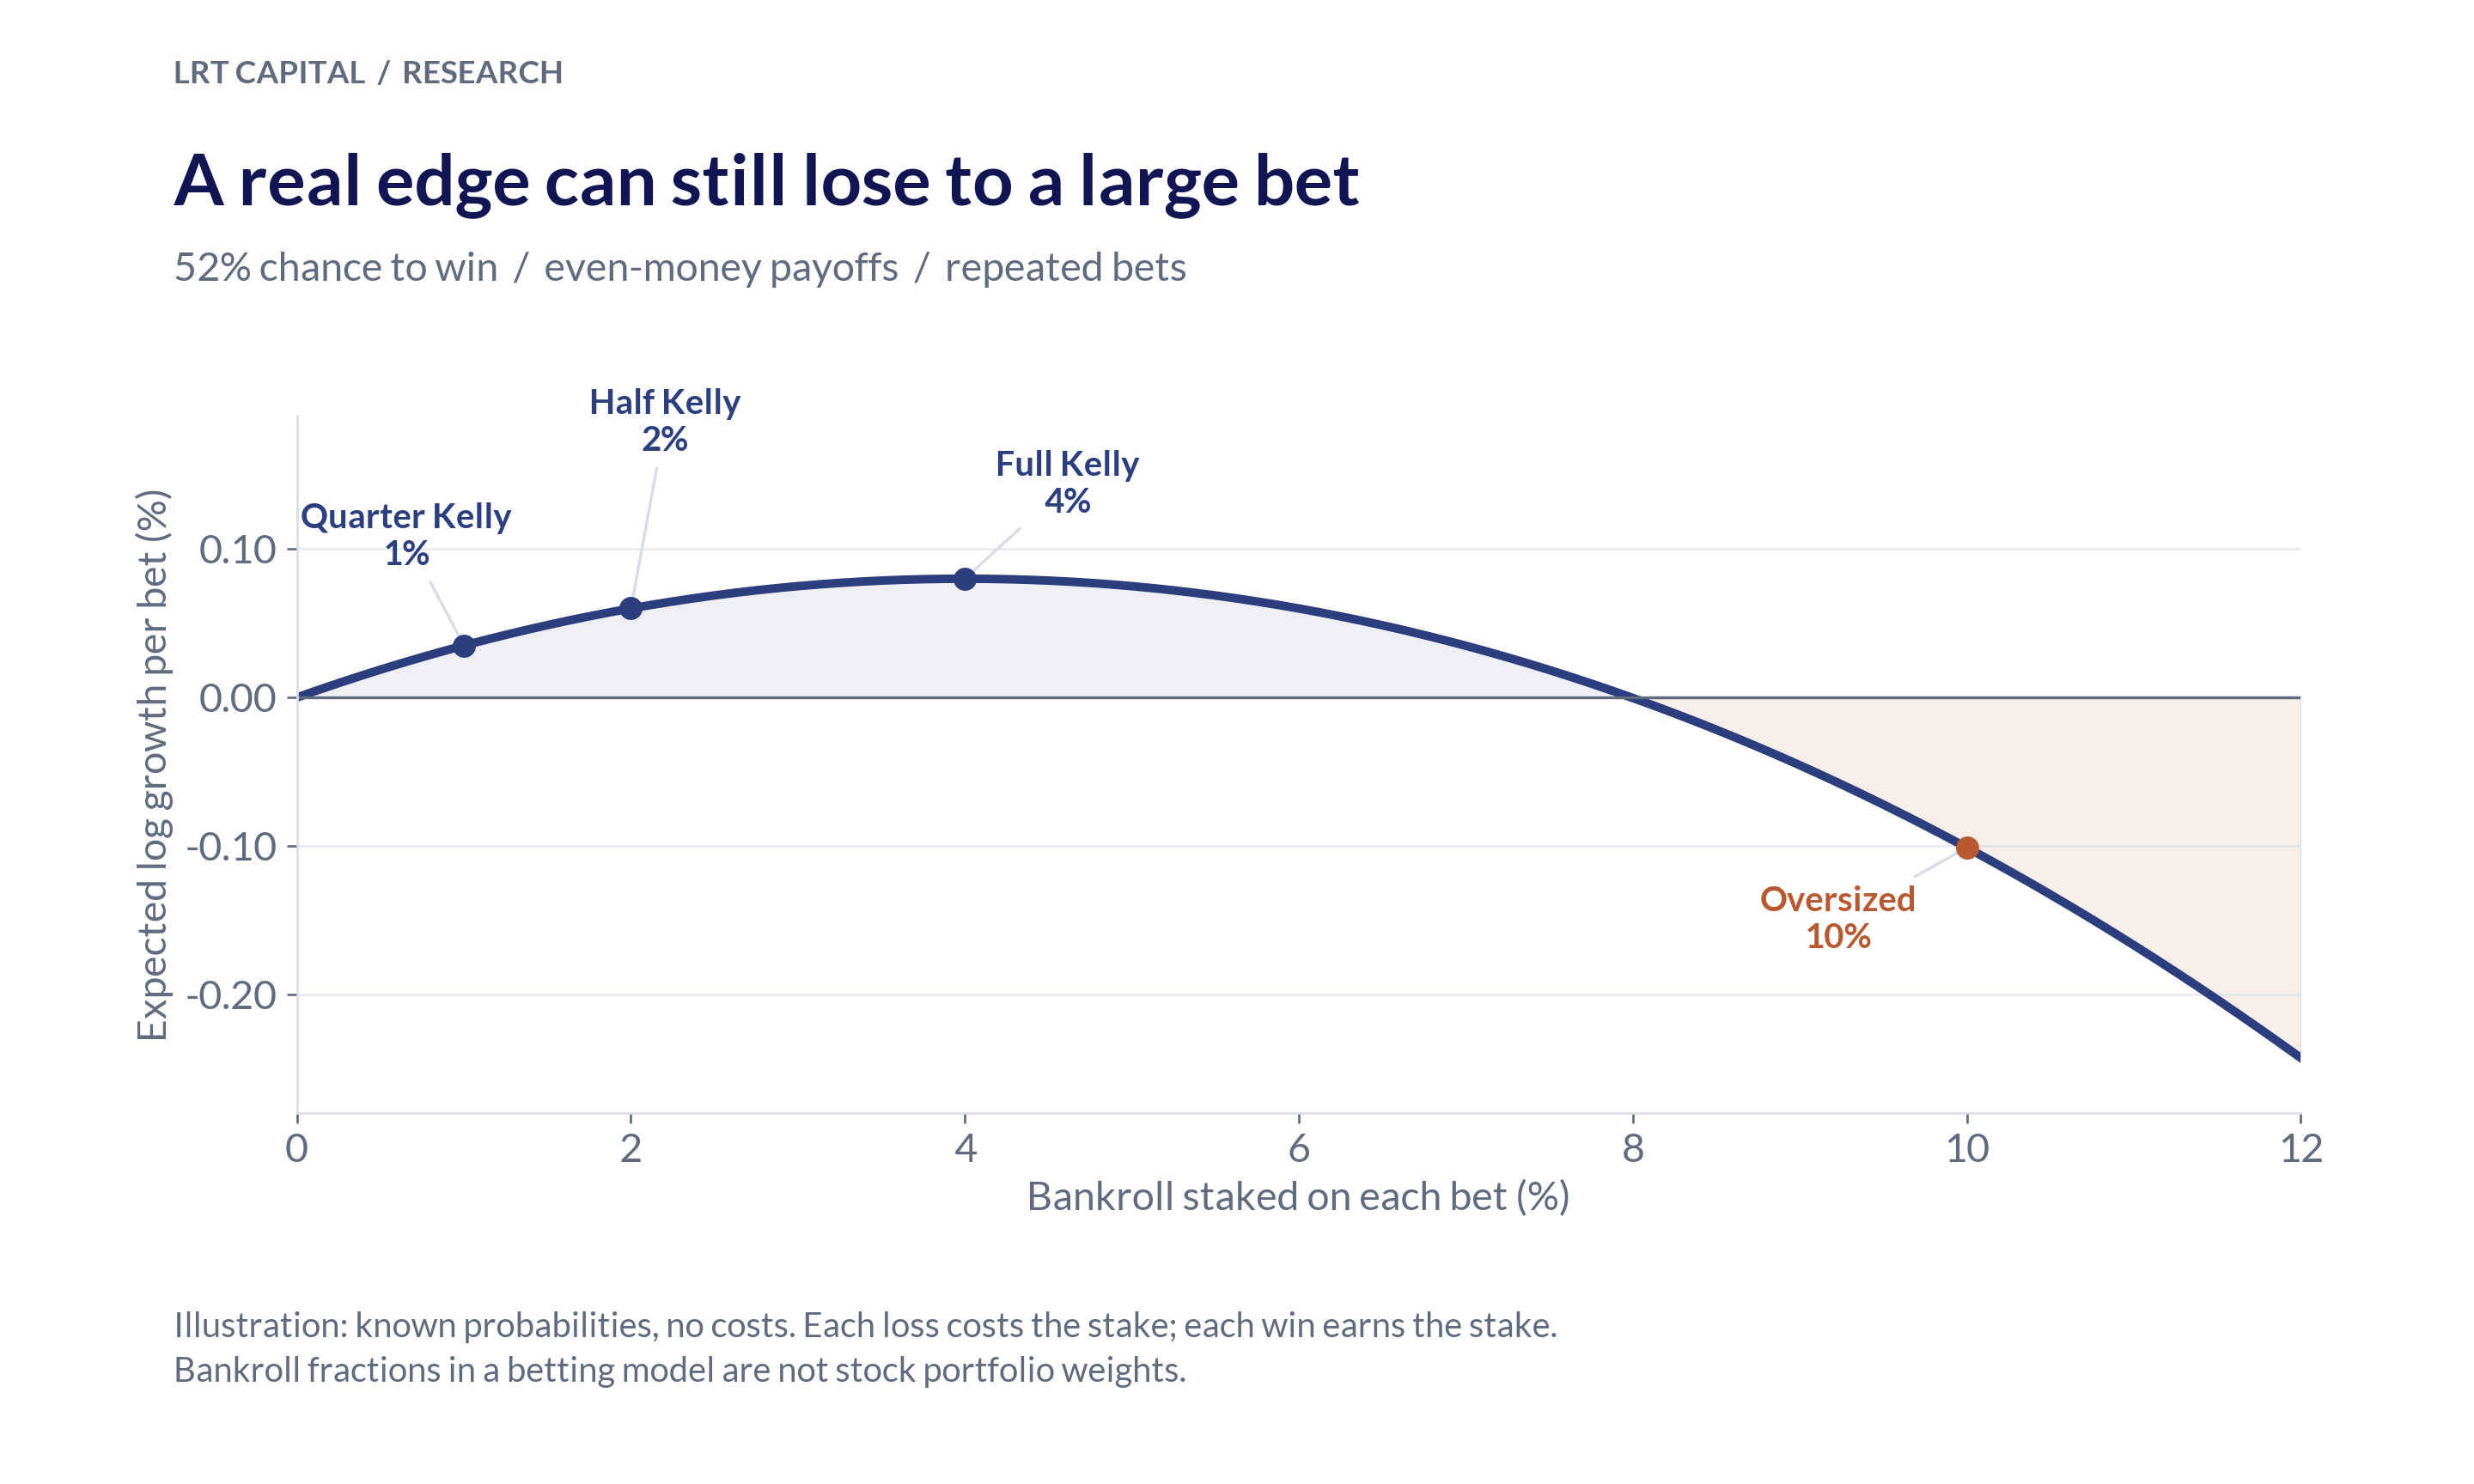
where p is the win probability. In the illustrative even-money game, this gives 4 percent at p = 0.52, 6 percent at p = 0.53, 8 percent at p = 0.54, and 10 percent at p = 0.55. These are full Kelly stakes—aggressive sizing that assumes perfect knowledge of the edge. They are fractions of the bankroll risked on a binary bet, not equity position weights.
These numbers might initially appear to justify the kind of position sizing that traditional concentrated managers use. They do not, for several reasons.
First, you almost never know your true edge. You estimate it from historical data, which introduces estimation error that is itself often larger than the edge being estimated. If you measure a 55 percent win rate from twenty years of data but the true edge is 52 percent, you will size at 10 percent when you should be sizing at 4 percent—massively overbetting.
Second, fractional Kelly reduces the damage from estimation error and model decay. In the small-return approximation with known inputs, half-Kelly retains about 75 percent of full-Kelly expected log growth while halving exposure. That is a model result, not a promise about realized fund volatility. Quarter-Kelly reduces exposure further when uncertainty is high. In the illustrative even-money game with a 53 percent win probability, quarter-Kelly stakes 1.5 percent of the bankroll rather than 6 percent.
Third, fractional Kelly is also a commitment device. Beyond the volatility argument, fractional sizing serves as a pre-commitment mechanism that prevents human override during euphoric or panicked periods. The institutional destruction of the "this time is different" impulse is at least as valuable as the volatility reduction—and often the harder thing to achieve.
Fourth, the binary even-money framework breaks for equities. Real positions have continuous, skewed return distributions and embedded correlations with other holdings. The right per-position framework is marginal contribution to portfolio Sharpe, not an isolated bet sizing. A position that looks attractive in isolation may merit a small weight because of its correlation with existing holdings; a position that looks marginal may merit a larger weight because of its diversification value.
Fifth, time horizons matter. Kelly maximizes long-run geometric growth assuming an investor with effectively infinite horizon. Fund managers face career risk; investors face withdrawal-driven horizon mismatches. Half-Kelly or quarter-Kelly helps align the manager's survival probability with the investor's actual risk tolerance.
The deeper insight is that a modest estimated advantage leaves little room for heroic sizing. The 1.5 percent stake in a 53 percent, quarter-Kelly game illustrates that caution. It does not establish a universal ceiling for stock weights. In a real portfolio, sizing must allow for shared risks, uncertainty about the edge, and the possibility that the measured advantage will disappear.
This is the discipline that separates systematic investors from those running on conviction and narrative.
The Concentration Question: Buffett, Venture Capital, and the Erosion of Information Edges
The case for concentration is seductive and has famous advocates. In his 1994 shareholder letter, Warren Buffett recalled putting about 40 percent of Buffett Partnership Ltd.'s capital into American Express in the mid-1960s after the salad-oil scandal. Venture capitalists similarly advocate concentrating capital in their best ideas. Such examples are often cited as evidence that concentration works, that great investors make concentrated bets, and that diversification is for the mediocre.
But this narrative misses several critical points: these examples actually support Kelly logic rather than contradict it, and the conditions that supported them have largely receded.
First, on the size of the edge. The information environment of the 1960s differed sharply from today's. An investor's work on a business could reveal facts or interpretations that were not already reflected in a widely shared consensus. That is a plausible reason a particular opportunity might support concentration. But we do not know Buffett's true ex-ante payoff probabilities from the eventual outcome. Calling his 40 percent position "Kelly-optimal" would claim a precision the historical record does not supply.
Second, on the bankroll. The early American Express position belonged to Buffett's partnership. It should not be described as a bet financed by Berkshire's later insurance float. Berkshire acquired National Indemnity in 1967, as its 2014 shareholder letter recounts. The broader capital-structure point still matters: stable capital and redemption-prone capital impose different demands. Insurance float also carries claims obligations; it is not free money without risk. Sizing depends on the capital actually available, its cost, and when it may have to be returned.
Third, on the informational environment today. Modern markets feature thousands of professional analysts, real-time information dissemination, regulatory mandates around fair disclosure, and quantitative systems that ingest every public data point within milliseconds. American Express in the nineteen-sixties would be analyzed by fifty equity research teams before market open today. Information asymmetries of the Buffett variety have been substantially eroded—though, importantly, not eliminated. Genuine edges still exist in special situations, distressed credit, complex structures, and markets where institutional capital cannot or will not play. They are simply rarer than the standard concentrated-fund pitch implies.
Venture capitalists similarly concentrate in their best ideas, but with two important qualifications. First, VC outcomes are highly skewed and binary in a way that public equities are not, so the right analogy is closer to a portfolio of call options than to repeated even-money bets. Second, VCs achieve diversification across many concentrated bets in different companies and across multiple funds. They are not running a single fund with ten concentrated positions; they are running a portfolio of many funds, each of which may be concentrated.
The critical insight is this: concentration is rational when the expected value of the bet is large enough to justify it, accounting for the actual payoff distribution. The mistake most modern public-equity managers make is not failing to concentrate when they should, but concentrating despite having only modest, symmetric edges. Concentration can also be rational with asymmetric payoffs—a deeply distressed credit position with limited downside but high carry, or a spinoff trading at a structural discount, can justify a larger weight even with modest hit rates because the payoff is not 1:1. The binary win-rate framework hides this nuance, and it is one of the legitimate reasons skilled value and special-situations investors run more concentrated than the Kelly-on-symmetric-bets math would suggest.
The seductive narrative around concentration emerges from survivorship bias. We see Buffett's American Express. We see early Sequoia bets. We do not see the hundreds of managers who concentrated despite modest edges and blew up. This makes concentration look smarter than it is—and tempts modern managers to imitate Buffett's position sizing without having Buffett's edge magnitude or his capital structure. They read the Wall Street Journal, talk to their car mechanic about industry trends, and convince themselves they have Buffett-like conviction. In reality, they have a modest statistical edge in markets that have grown vastly more efficient over the past sixty years, deployed against a bankroll that can be redeemed at any time.
Confounding Multiple Sources of Alpha: Hidden Multi-Factor Overbetting
A further complication: investors often generate signals from multiple, orthogonal sources but fail to express them distinctly. A manager may have:
- A genuine modest edge on idiosyncratic stock selection
- A legitimate thesis on the energy cycle or semiconductor supply chain
- A reasonable macro view on interest rates or geopolitical risk
But rather than express these as separate, diversified bets sized according to their individual edge, the manager bundles them into concentrated positions. Stated formally: the manager believes they are making one bet, but they are actually making N partially independent bets, and the joint probability of all of them paying off collapses.
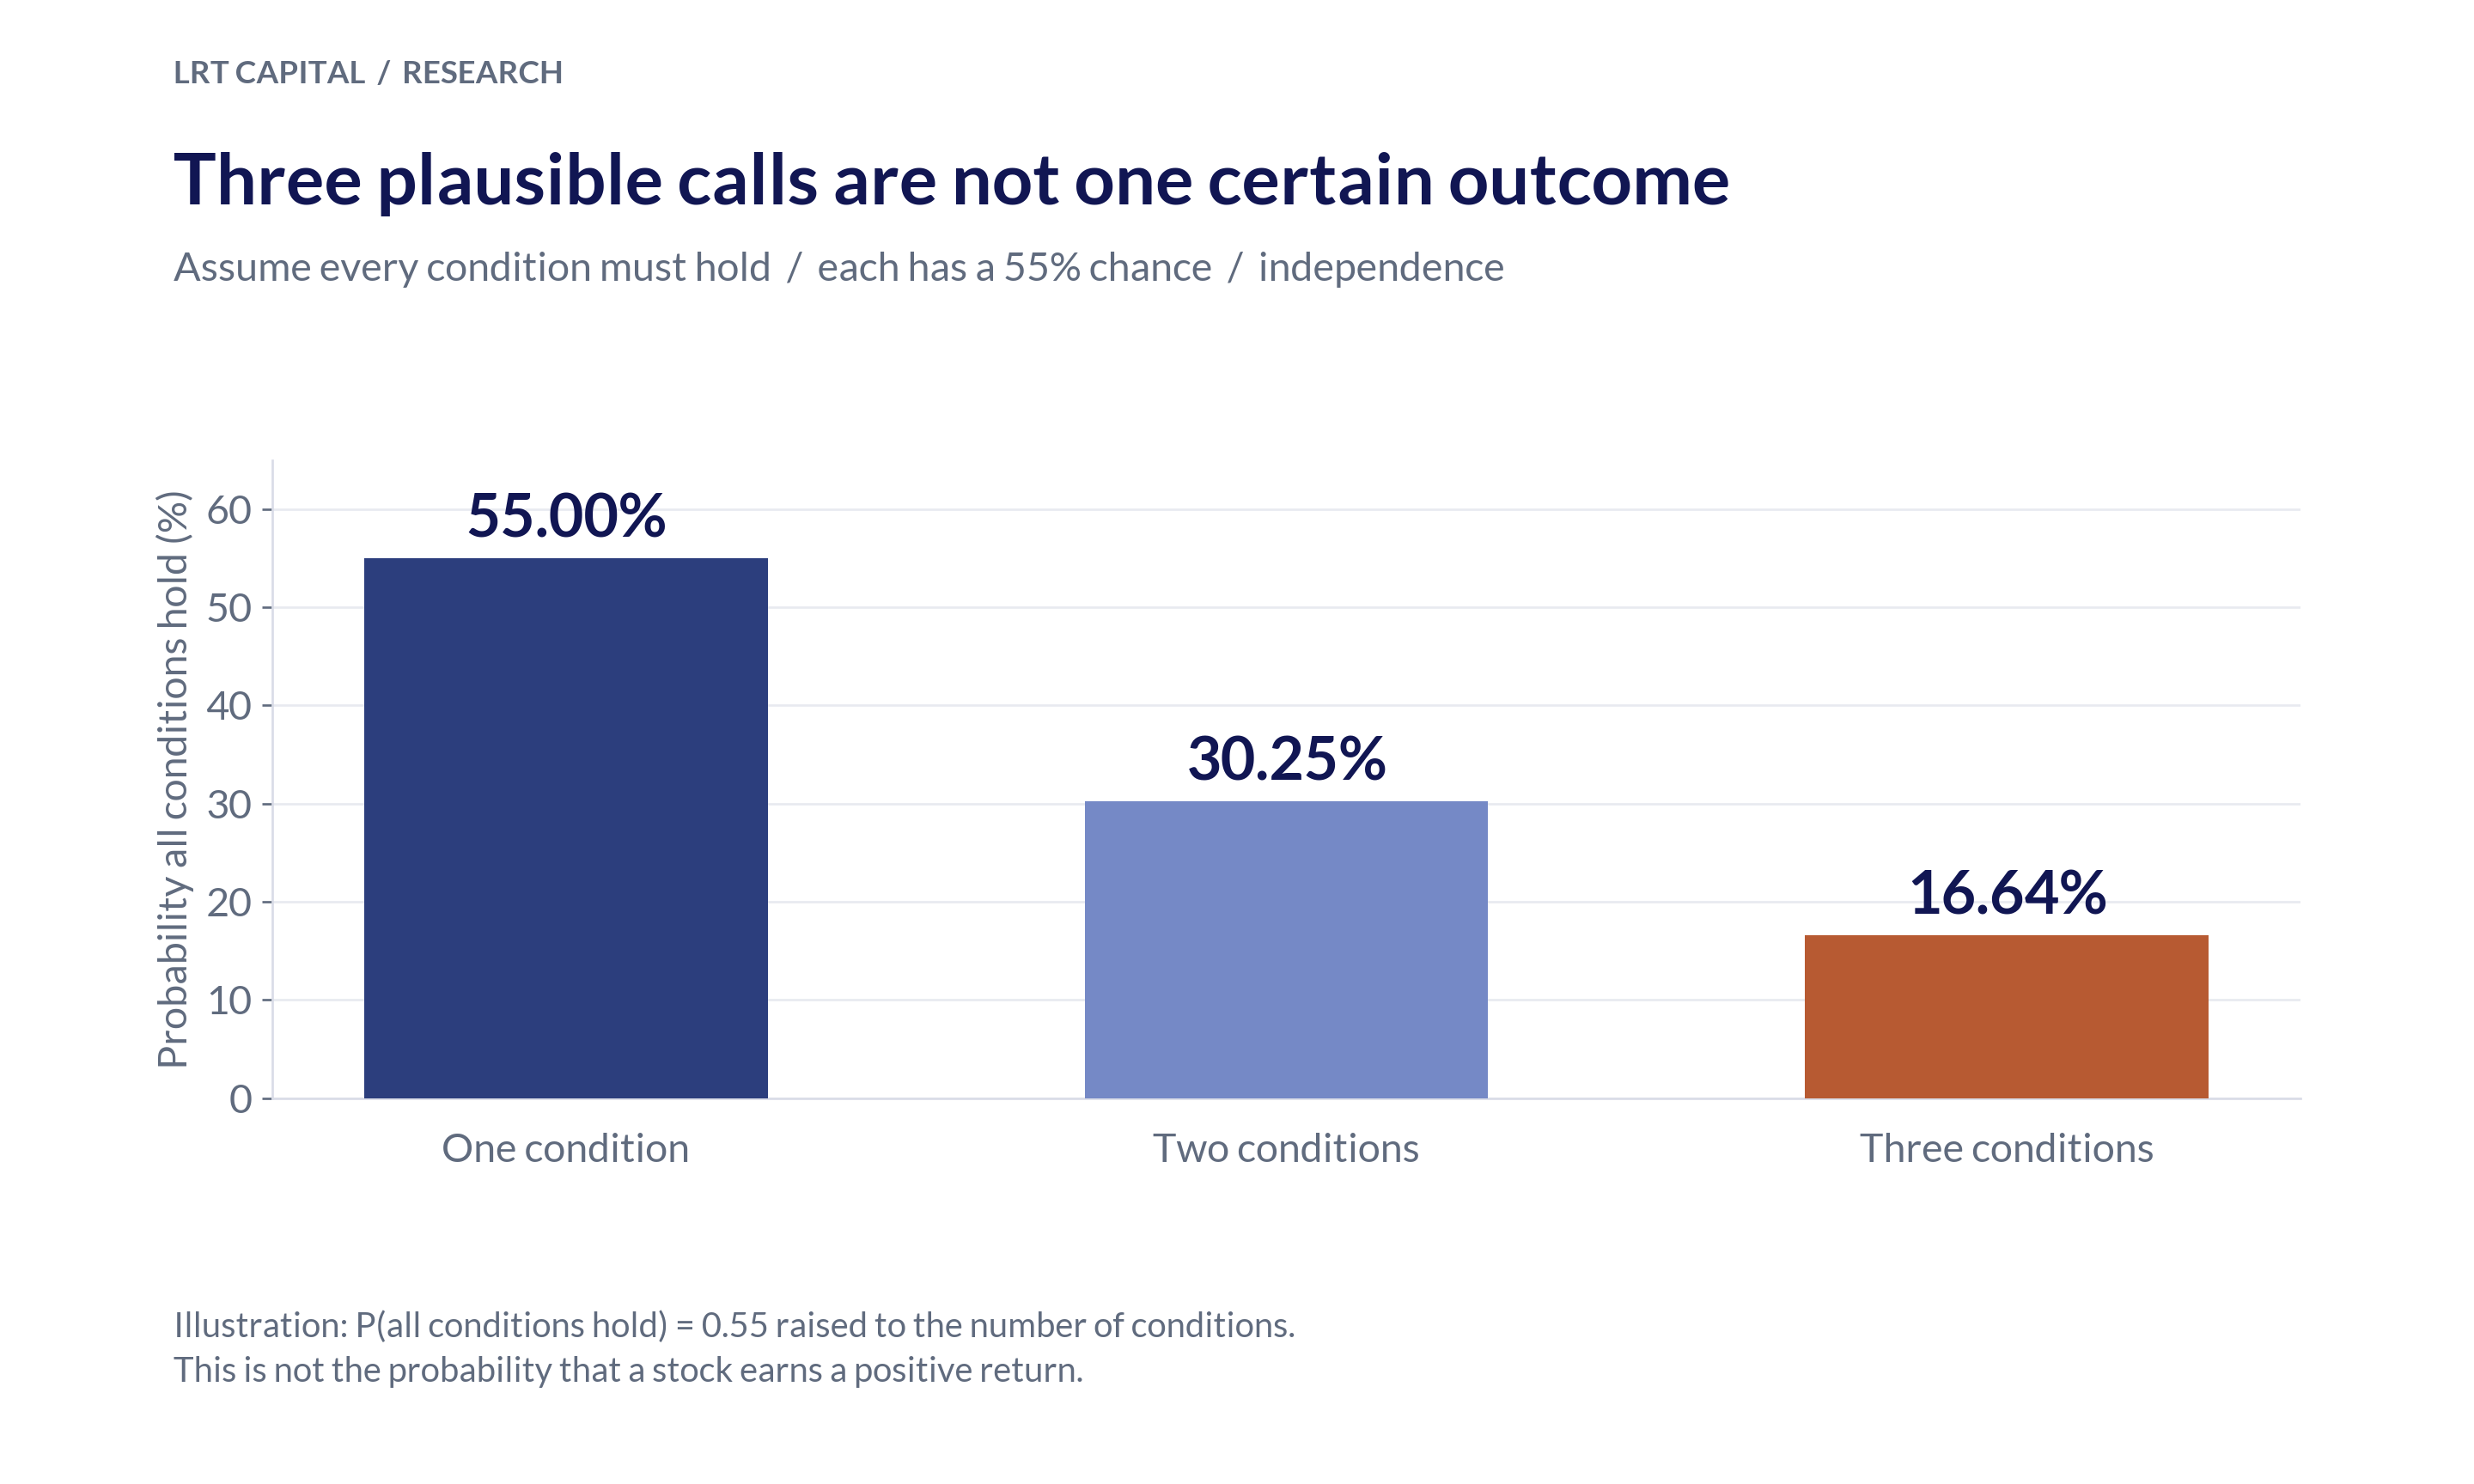
This can create hidden risk when the investment needs several uncertain conditions to hold at once. If each of three conditions has a 55 percent probability, and the conditions are independent, the probability that all three hold is 0.55³, or about 16.6 percent. That calculation only applies when all three are necessary for the outcome being evaluated. It is not the probability that the stock makes money, and dependent conditions cannot be multiplied this way. The useful question is which assumptions the payoff truly requires and how those assumptions interact.
This bundling problem is endemic to single-manager structures and difficult to solve without organizational design changes. It is perhaps the most underappreciated reason that concentrated fundamental funds tend to underperform their stated edge over a full cycle.
Single Fund Managers: The Structural Problems
Problem One: Concentration and Survivorship Bias
Single-manager funds typically operate with high conviction and significant position concentration. A talented manager believes deeply in their process and their stock picks. They construct portfolios with meaningful conviction weights—perhaps 8 to 12 percent in their best ideas, 1 to 2 percent in their weakest positions.
This approach has a seductive narrative: if you have genuine skill, concentration amplifies returns. Over a hot streak, this is true. A concentrated manager who gets lucky early compounds wealth rapidly, grows assets under management, builds a brand, and becomes visible in the market. They tell a compelling story. They appear in interviews. They raise capital.
But here is the problem: we only observe the concentrated managers who got lucky. The equally skilled manager who was concentrated in the wrong names, or whose edge temporarily decayed, or who simply experienced bad variance early on—that manager shrinks, closes the fund, and disappears. We never hear from them.
This creates a profound selection bias in how we perceive single-manager performance. The managers we know about are massively overrepresented among the lucky winners. We mistake luck plus skill for pure skill, and we mistake concentration plus luck for an optimal strategy.
It is worth acknowledging the other side: some single managers do succeed over long horizons. Often they succeed not by violating Kelly discipline but by quietly approximating it—running lower net exposure than they advertise, diversifying more than the marketing suggests, adapting position sizes dynamically as conditions change, and refusing to add to concentrated positions that have already worked. The best long-term single managers tend to look much more like systematic risk managers than the conviction-driven stock pickers their pitch decks describe. Their structural success is consistent with Kelly logic, even when their narrative is not.
Problem Two: Bundling and Confounded Edges
Fundamental managers often have genuine insights across multiple dimensions: individual company moats, sector trends, macro cycles, market timing. A manager might truly understand the semiconductor cycle, or the energy market, or how to identify competitive advantages in insurance companies.
But here is the critical flaw: they bundle all these insights into a single concentrated portfolio without properly segregating them.
Consider a manager with genuine foresight on the oil cycle. They forecast higher prices ahead and want to express this view. They could do it cleanly by building a diversified basket of energy names weighted by quality and valuation, or by using a sector ETF or futures position. Instead, they select five companies they like, overweight the ones they like most, and add macro conviction weights on top. Now their portfolio reflects three different things simultaneously:
- Their idiosyncratic stock-picking edge (modest, in the typical range)
- Their macro oil-cycle view (unknown probability)
- Their sector allocation bet (unknown probability)
If they are right on the macro call but wrong on individual stock selection, they might still lose money. If they are right on both but get hit by idiosyncratic company risk—an earnings miss, a technical failure—their edge collapses. They have accidentally loaded the portfolio with uncorrelated risks that destroy their actual edge.
Even granting a 55 percent probability on each dimension, three independent conditions would all hold only about 16.6 percent of the time. But that is a calculation about the joint assumptions, not a complete investment payoff model. A stock might make money when one condition fails or lose money even when all three hold.
The manager may be taking concentrated risk without knowing which combination of company, sector, and macro outcomes the payoff requires. That is the hidden multi-factor sizing problem. Separating those exposures makes the assumptions visible and gives the investor a chance to size each risk deliberately.
Problem Three: Absence of Real Risk Management
Single managers typically have soft risk management. They have stop-losses, position limits, or drawdown thresholds that trigger strategy review. But they lack the institutional discipline to quickly detect and eliminate decaying edges.
A manager's edge might stem from:
- A unique information advantage (relationships, expertise)
- A specific market inefficiency
- A statistical pattern in company financials
- A forecasting skill on macro conditions
These edges have lifespans. Information gets arbitraged. Markets adapt. Patterns break. A manager who had genuine edge in identifying companies with improving return on capital might find that edge disappears as the market becomes more efficient at pricing quality.
The problem is that a manager with a ten or twenty-year track record has strong incentive and psychological ammunition to believe their process still works. They will rationalize a few years of underperformance as cyclical, blame market conditions, or point to periods where their process would have worked. By the time they honestly acknowledge that their edge has decayed, they have often lost significant assets.
There is no automatic circuit-breaker. There is no external system watching for decay. The manager is judge, jury, and executioner of their own process. And human psychology being what it is, most managers will convince themselves their process is fine far longer than the evidence warrants.
The Macro Problem: Overbetting Against Honest Expected Value
Taken together, these three problems lead to a simple conclusion: single managers, on average, overbet relative to honest expected-value math.
They overestimate their edges. They underestimate volatility and correlation. They bundle uncorrelated bets without properly accounting for the compounding effect of estimation error. And they lack the discipline to right-size their portfolios based on realistic edge assessment.
The error is rarely a clean factor of 10x or 100x; it is often subtle. A manager sizing their best position at 8 percent might have a true edge that, properly accounting for estimation error, fractional Kelly, and bundling, justifies 2 to 3 percent. That is overbetting by a factor of three or four—not catastrophic in any single year, but corrosive over a full cycle, especially because the cost of overbetting is asymmetric: the drawdowns from concentrated bad luck are larger than the upside from concentrated good luck, due to the geometry of compounding.
In a bull market, you do not see the cost of that overbetting. You just see great returns. It is only when volatility spikes or markets turn that the concentration risk reveals itself.
The Concentrated High-Conviction Trap: Benchmark Constraints and the Illusion of Active Management
Within the single-manager paradigm, a particularly pernicious failure mode has emerged: the explicitly concentrated, high-conviction portfolio. These funds are launched with mandates to hold perhaps 8 to 20 names, branded as "only our best ideas" or "conviction portfolios." The narrative is compelling: why hold a hundred mediocre ideas when you can own ten great ones?
The answer, revealed through both theoretical analysis and empirical catastrophe, is that this structure violates expected-value discipline while creating the illusion of active management.
The Twenty-Stock Fund Trap
Several prominent asset managers have launched separate fund products built around concentrated, high-conviction portfolios. A manager with a quality-and-growth methodology, for instance, might launch a US fund holding 20 names and a parallel international fund holding 20 names. The pitch to investors is straightforward: "We have identified our 20 best ideas. This fund concentrates capital there."
This deserves closer examination. Equal-weighting 20 stocks implies 5 percent of capital in each name. In a separate even-money betting game, a 5 percent stake corresponds to a 52.5 percent win probability at full Kelly, 55 percent at half-Kelly, or 60 percent at quarter-Kelly. Those are valid calculations for the game. A 5 percent stock weight is not a 5 percent binary stake, so the game cannot establish the stock-picker's required win rate. The real question is whether the expected payoffs, shared risks, and uncertainty support that concentration.
The problem compounds when bundling enters. These 20 stocks are not selected purely on idiosyncratic merit. They reflect the manager's views on growth trends, sector rotation, market cycles, and macro conditions. Each position is implicitly several bets, and the combined risk is far greater than the manager acknowledges.
The result is predictable: these concentrated funds perform well during bull markets when their factor exposure is in favor and luck smiles on them. But when the cycle turns or luck reverses, they experience massive drawdowns. The concentration that amplified gains on the way up amplifies losses on the way down.
Benchmark-Constrained Portfolios: The Worst of Both Worlds
A particularly awkward variant is the benchmark-constrained concentrated portfolio, found in some university endowments, student-managed funds, and institutional mandates. The manager has explicit limits on how far the portfolio may depart from a benchmark such as the S&P 500.
One version permits active overweights in 8 to 10 stocks while limiting deviations from individual benchmark weights to 100 basis points. An active weight is the difference between a portfolio weight and its benchmark weight. Tracking error is the volatility of the portfolio's return relative to the benchmark. A 100-basis-point active-weight limit is not a 100-basis-point tracking-error limit.
This is the worst possible outcome for expressing edge. The constraints are too tight to allow genuine risk-taking, yet too loose to force true diversification. The result:
The concern is a mismatch between the active bets, the permitted risk, and the cost of running the strategy. Small active weights can limit the effect of a useful forecast. Larger weights can introduce company-specific risk. Whether that tradeoff is worthwhile depends on the actual opportunity and the portfolio's combined exposures.
A tight active-risk budget can leave too little expected active return to cover fees and trading costs. That is the economic concern. It is not a mathematical proof that every constrained portfolio must underperform, and this paper does not present an empirical study of student-managed or institutional mandates.
This can teach the wrong lesson to students and emerging managers: that active management is about naming a few conviction stocks without examining the portfolio they create. A useful mandate connects the research advantage to an explicit risk budget and asks whether the expected benefit exceeds its costs. Diversification and systematic portfolio construction require a different skill set from company selection. The constraint itself neither supplies that skill nor makes failure inevitable.
The Real-World Collapse of Concentrated High-Conviction Funds
The framework also raises questions about concentrated funds that grow quickly during a favorable cycle and later shrink sharply. The following anonymous example comes from the original paper; it is an anecdote, not a documented dataset. Changes in assets under management can reflect redemptions as well as investment returns.
Consider a prominent fund manager who built a reputation on a concentrated 10-to-12-stock portfolio. For roughly a decade, this concentrated approach worked spectacularly. Assets under management grew from hundreds of millions to over six billion dollars. The manager became well-known, published investment theses, and built a brand around concentrated conviction investing.
Then the market environment changed. The concentrated positions experienced idiosyncratic headwinds. The manager's process, which had been vindicated for a decade, suddenly stopped working. Within a few years, assets under management collapsed from approximately six billion to roughly two hundred million. The concentration that had amplified gains during the good years amplified losses during the bad years.
This pattern repeats across concentrated funds. A manager identifies a thematic edge—for example, "disruptive innovation" or "private equity-style public market investing"—and builds a concentrated portfolio around it. For a market cycle or two, when that theme is in favor, the fund performs spectacularly. Assets grow. The manager raises capital and increases AUM. But the edge, which was often more about being early on a market theme than about genuine security selection skill, eventually degrades as the theme becomes crowded or market conditions shift. The fund experiences drawdowns of 50 to 80 percent, and investors who entered near the peak are devastated.
Process Drift and Narrative Camouflage
A final and especially insidious failure mode of concentrated high-conviction funds is process drift: the gradual or sudden shift from an explicitly stated investment process to chasing whatever is hot in the market.
Consider a concentrated manager with a stated methodology of quality growth at reasonable prices. For several years, the strategy works as advertised. Then growth and momentum become dominant market themes, and gradually the manager's portfolio becomes loaded with high-multiple SaaS names, expensive technology stocks, and momentum plays. The manager rationalizes this as "an evolution of our process" or "identifying the next big trend." In reality, they have abandoned their stated process and chased performance.
When the cycle reverses—as happened violently in 2022 for growth and software names—these crowded trades unwind sharply. The fund experiences catastrophic drawdowns.
Investors who allocated based on the original stated methodology find themselves holding a portfolio that no longer resembles what they bought into.
What is particularly revealing is examining multiple concentrated managers with seemingly different investment philosophies during the same period. One describes their process as "disruptive innovation." Another talks about "private equity approaching public markets." A third focuses on "quality growth at reasonable prices." A fourth pitches "thematic long-term compounders." The narratives sound completely different.
The original paper describes managers whose returns became highly correlated during the 2020–2022 growth-stock cycle. It does not supply a reproducible fund panel or a common measurement window, so the correlation and drawdown ranges should be read as the author's observations rather than independently established results. The testable question is whether apparently different strategies are exposed to the same growth, technology, software, and liquidity risks.
Different stories, same factor exposure.
This is the deeper concern about the concentrated high-conviction model: the narratives may fail to describe different sources of return. A portfolio can express a correlated exposure to a factor or theme while being marketed as a differentiated process. When the factor works, the managers look brilliant together. When it stops working, they can fall together. The allocator needs to test how much of the return came from that common exposure and how much came from something else.
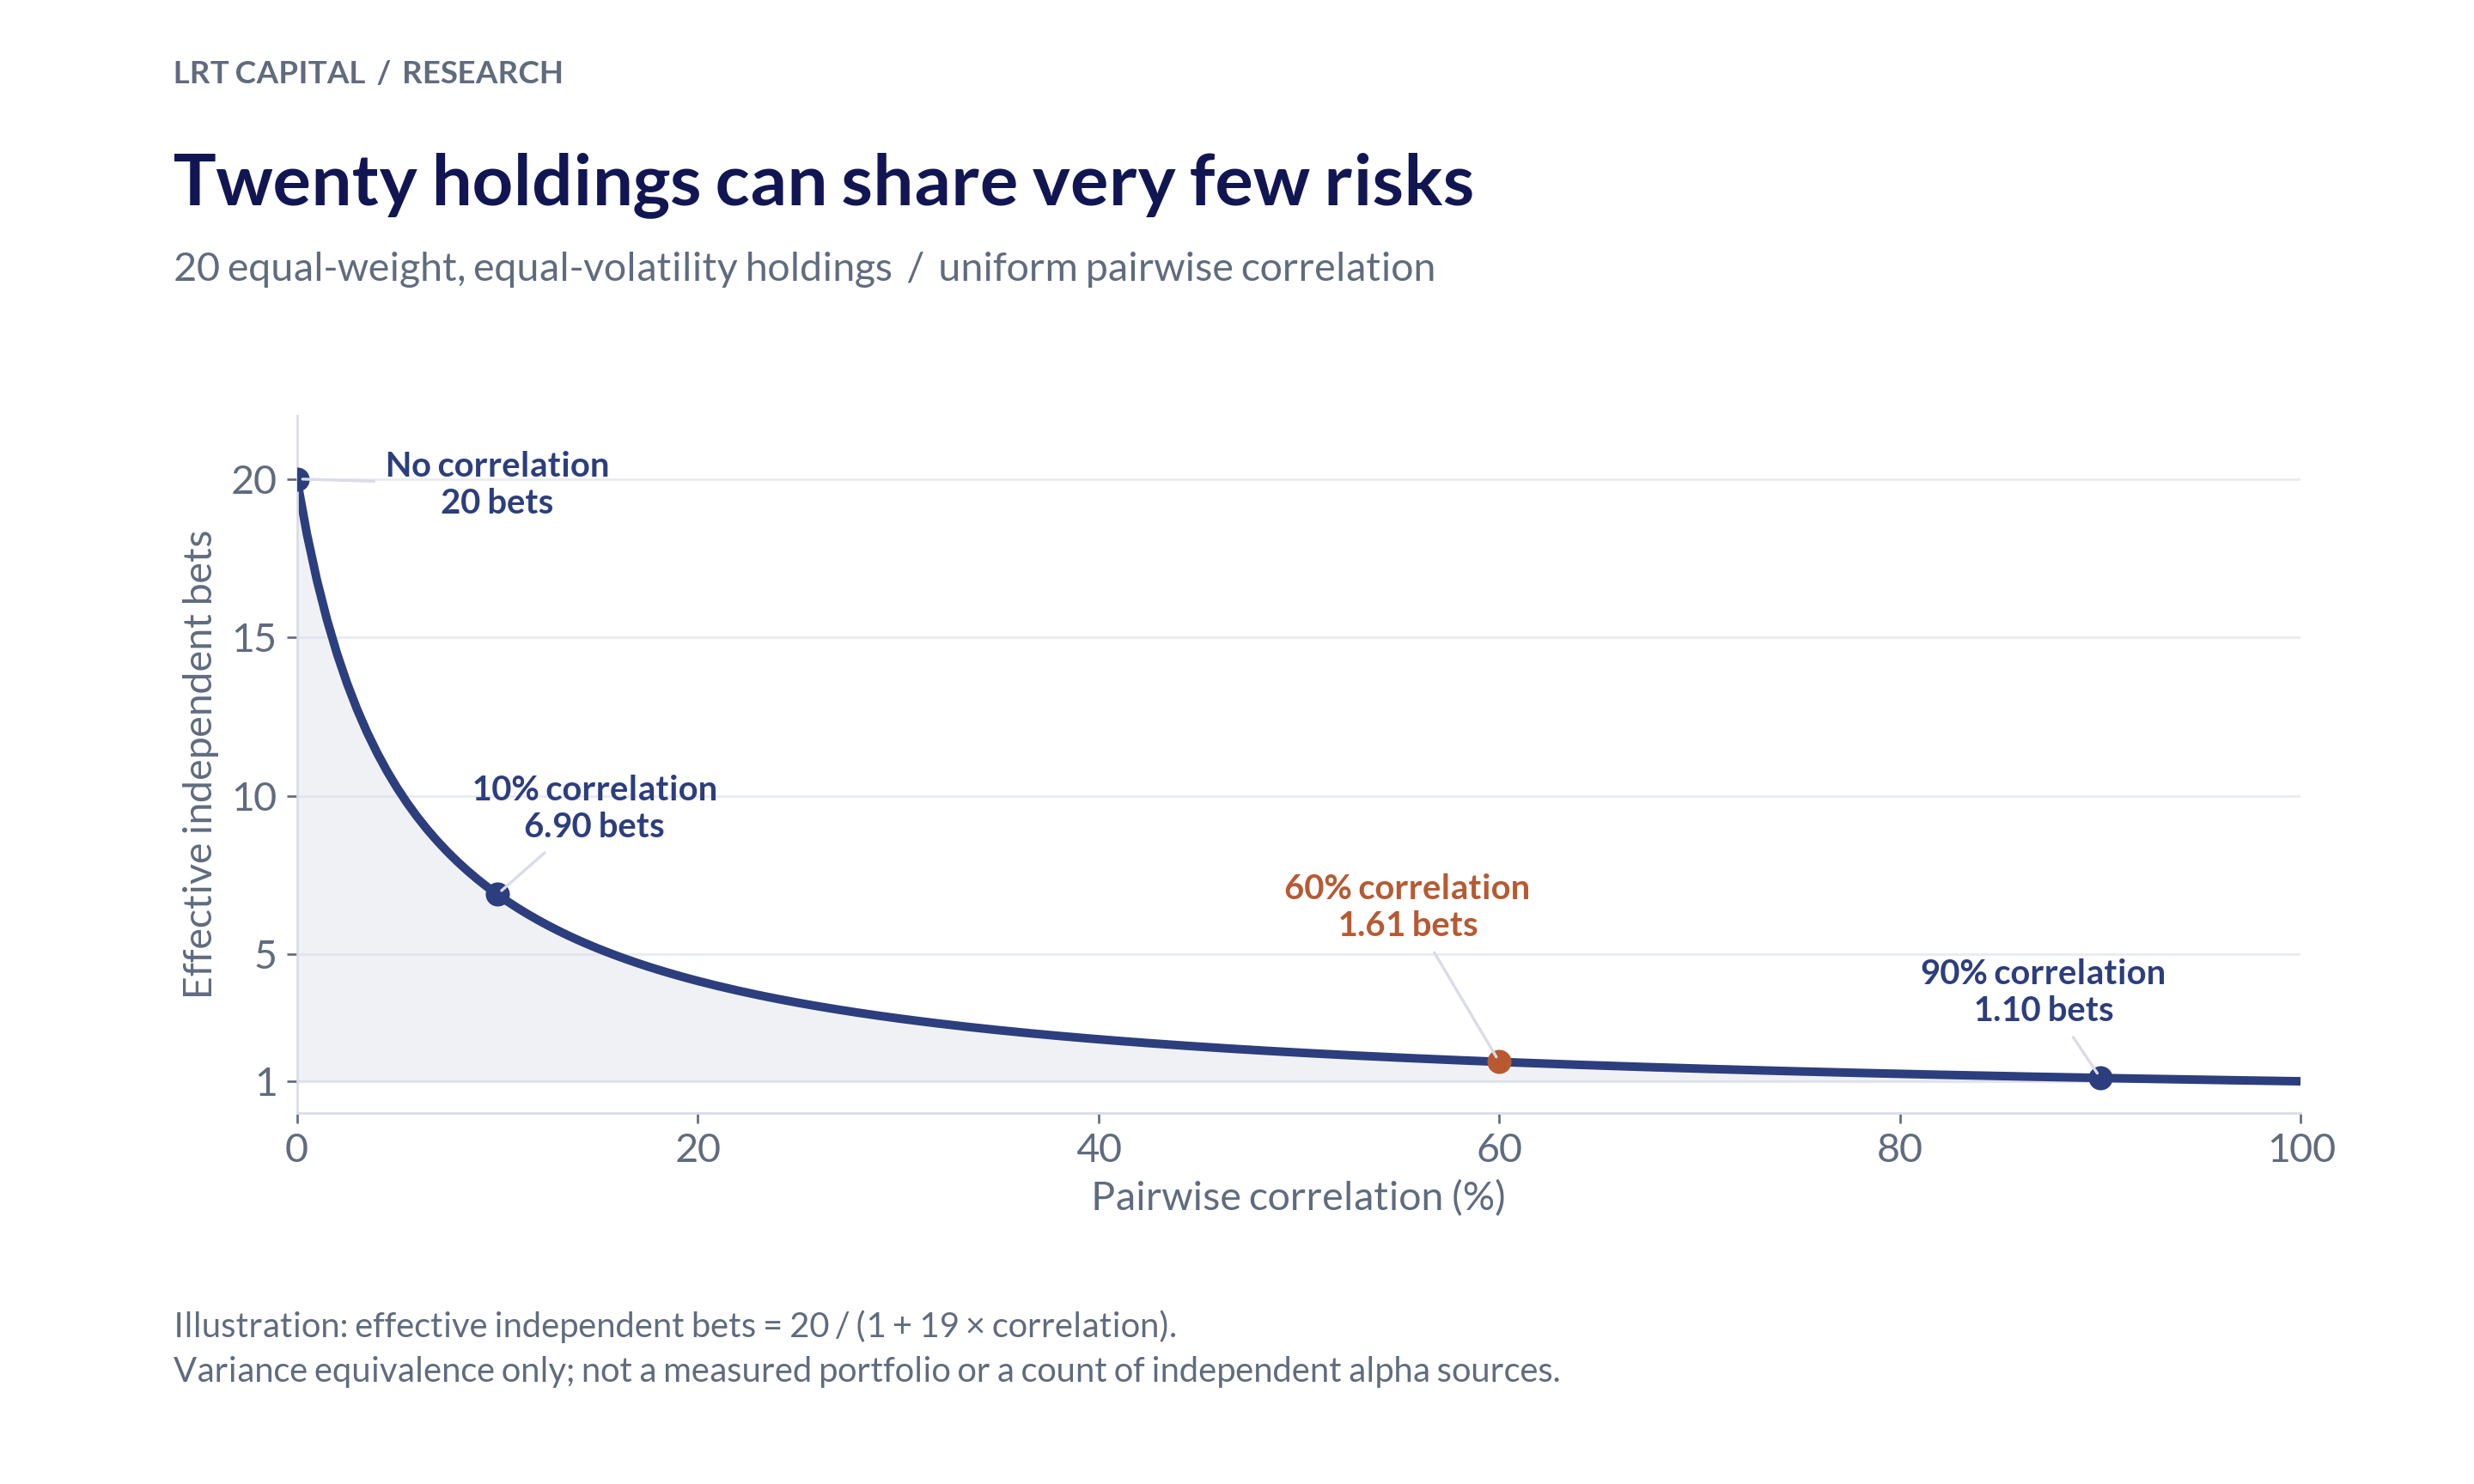
The lesson is that investors evaluating concentrated managers must look past the marketing narrative to the actual factor exposures of the portfolio. If five managers with different philosophies have correlations near 0.9, the allocator should investigate what they share. High correlation is evidence of common movement; it does not by itself prove that none of the managers generates alpha.
Pod Shops: A Structural Solution to Single-Manager Problems
Pod shops and multi-manager platforms attack these problems through organizational design. Instead of a single manager bundling multiple edges into a concentrated portfolio, a pod shop separates security selection from portfolio construction and enforces systematic discipline.
Separating Clarity from Conviction
In a pod structure, individual analysts or small teams—the pod—focus narrowly on generating signals for specific securities. They have a defined process: identify companies with durable competitive advantages, assess management capital allocation, evaluate financial condition, generate predictions about which stocks will outperform within a defined sector or style.
Critically, this process is explicit and bounded. The pod is not trying to forecast macro cycles or time sectors. They are not making a view on the oil price or the Federal Reserve. They are simply asking: "Based on our process, which securities are mispriced relative to their fundamentals?"
This clarity is powerful because it allows honest assessment of edge. If the pod is genuinely 53 percent accurate at picking winners within their domain, that is measurable and real. It does not get hidden under macro narratives or timing calls that the pod does not actually have skill at.
The pod develops deep expertise in its domain—industrials, healthcare, financial services, consumer staples. They know those industries thoroughly. They talk to management teams. They understand the competitive dynamics. Their modest edge becomes real and defensible, not just lucky.
Enforced Diversification and Sizing Discipline
Once the pod generates signals, those signals are passed to a portfolio overlay function. The overlay does not concentrate in the pod's best ideas. Instead, it applies systematic position sizing based on signal strength, marginal contribution to portfolio risk, and exposure constraints.
Most pods operate with equal-weight or signal-weighted approaches where no single position exceeds a strict threshold (often 1 to 2 percent per name). This is crude but protective. It forces the organization to make 50 or 100 bets rather than 15.
A broad set of small positions can reduce exposure to any one company, provided the holdings do not all share the same risks. That is the useful discipline. A count of 100 holdings does not by itself establish that the portfolio is below Kelly or that the risks are independent. The risk model and the payoff estimates still have to do that work.
The psychological benefit is equally important: equal-weighting removes conviction bias. The portfolio manager cannot override the system because they have a strong feeling about one stock. The system sizes positions based on signal strength, period.
Active Edge Decay Detection
The second structural advantage of pods is rapid decay detection. Most multi-manager platforms have built-in monitoring systems that track whether each pod's signal generation process is actually working. They measure win rate of pod recommendations versus benchmarks, Sharpe ratio of pod signals over rolling windows, correlation between pod signals and subsequent returns, and the volatility and drawdown profile of pod recommendations.
If the pod's win rate slips meaningfully below its historical baseline—say, from 53 percent to below 50 percent—the monitoring system flags it. The portfolio overlay can reduce or eliminate capital allocated to that pod, redeploying it to pods that are still generating alpha.
Decay detection cuts both ways, however, and is worth qualifying. Distinguishing genuine edge decay from a temporary unfavorable regime is genuinely difficult. A pod that has lost its edge looks similar, in any given quarter, to a pod whose process is fine but whose factor tilt is temporarily out of favor. Aggressive monitoring systems risk false positives—prematurely firing productive pods after bad luck or short cycles. Lax systems risk the opposite, allowing decayed processes to bleed capital. The right calibration is an empirical question, and platforms differ meaningfully in how well they navigate it. The argument here is not that monitoring is infallible, but that some mechanism for systematic edge re-evaluation is structurally superior to a single manager rationalizing their own underperformance for a decade.
Even granting the false-positive risk, the comparison is favorable: a talented manager whose true edge has decayed without detection for three years has destroyed enormous value during that period. A pod with a modest edge whose monitoring catches decay—even imperfectly—preserves value continuously. Over time, the second approach wins.
The Organizational Alignment
Pod structures can tie compensation and risk budgets more closely to measured contribution after costs. Actual compensation arrangements vary by platform; they are not universally based on a pod's Sharpe ratio. The organizational aim is to reward a repeatable contribution rather than a compelling story, and to make the source of returns visible.
What Pod Shops Don't Solve
It would be misleading to present pod shops as a clean solution. The structure introduces real frictions and risks that erode the theoretical advantages:
Cost drag. Pod shops are expensive. Pod compensation is generous, infrastructure is heavy, and the platform must pay for risk systems, technology, and centralized hedging operations. These costs are paid out of gross alpha and can consume a meaningful share of the discipline premium.
Crowding. Independent pods analyzing similar universes with similar frameworks tend to converge on similar signals. Two healthcare pods at two different platforms can hold meaningfully overlapping books, especially in liquid large-cap names. Crowding shows up most violently in stress periods, when correlations spike and the supposed independence of pod signals breaks down.
Turnover and transaction costs. Continuous reoptimization at the central book level, combined with pod-level signal updates, generates substantial turnover. Slippage, market impact, and financing costs scale with turnover and can eat a meaningful fraction of the gross edge—particularly in less liquid names and during stress.
False precision in monitoring. Aggressive signal monitoring can overfit noise. If you measure pod performance with too short a window, you will detect "decay" that is just normal variance, and you will allocate capital based on patterns that do not exist. The opposite error—too long a window—lets decayed pods bleed capital. There is no clean answer.
The honest framing is that pod shops solve the behavioral and sizing problems that plague single managers, but they introduce cost, crowding, and overfitting risks that can erode the theoretical advantage. The structural argument still holds—the discipline is genuinely better—but the net benefit after frictions is smaller than the gross benefit on paper.
The Central Book as a Source of Risk-Adjusted Returns
The most underappreciated element of multi-manager pod shop structures is not the individual pods themselves, but the central book—the portfolio construction and aggregation layer that sits atop them.
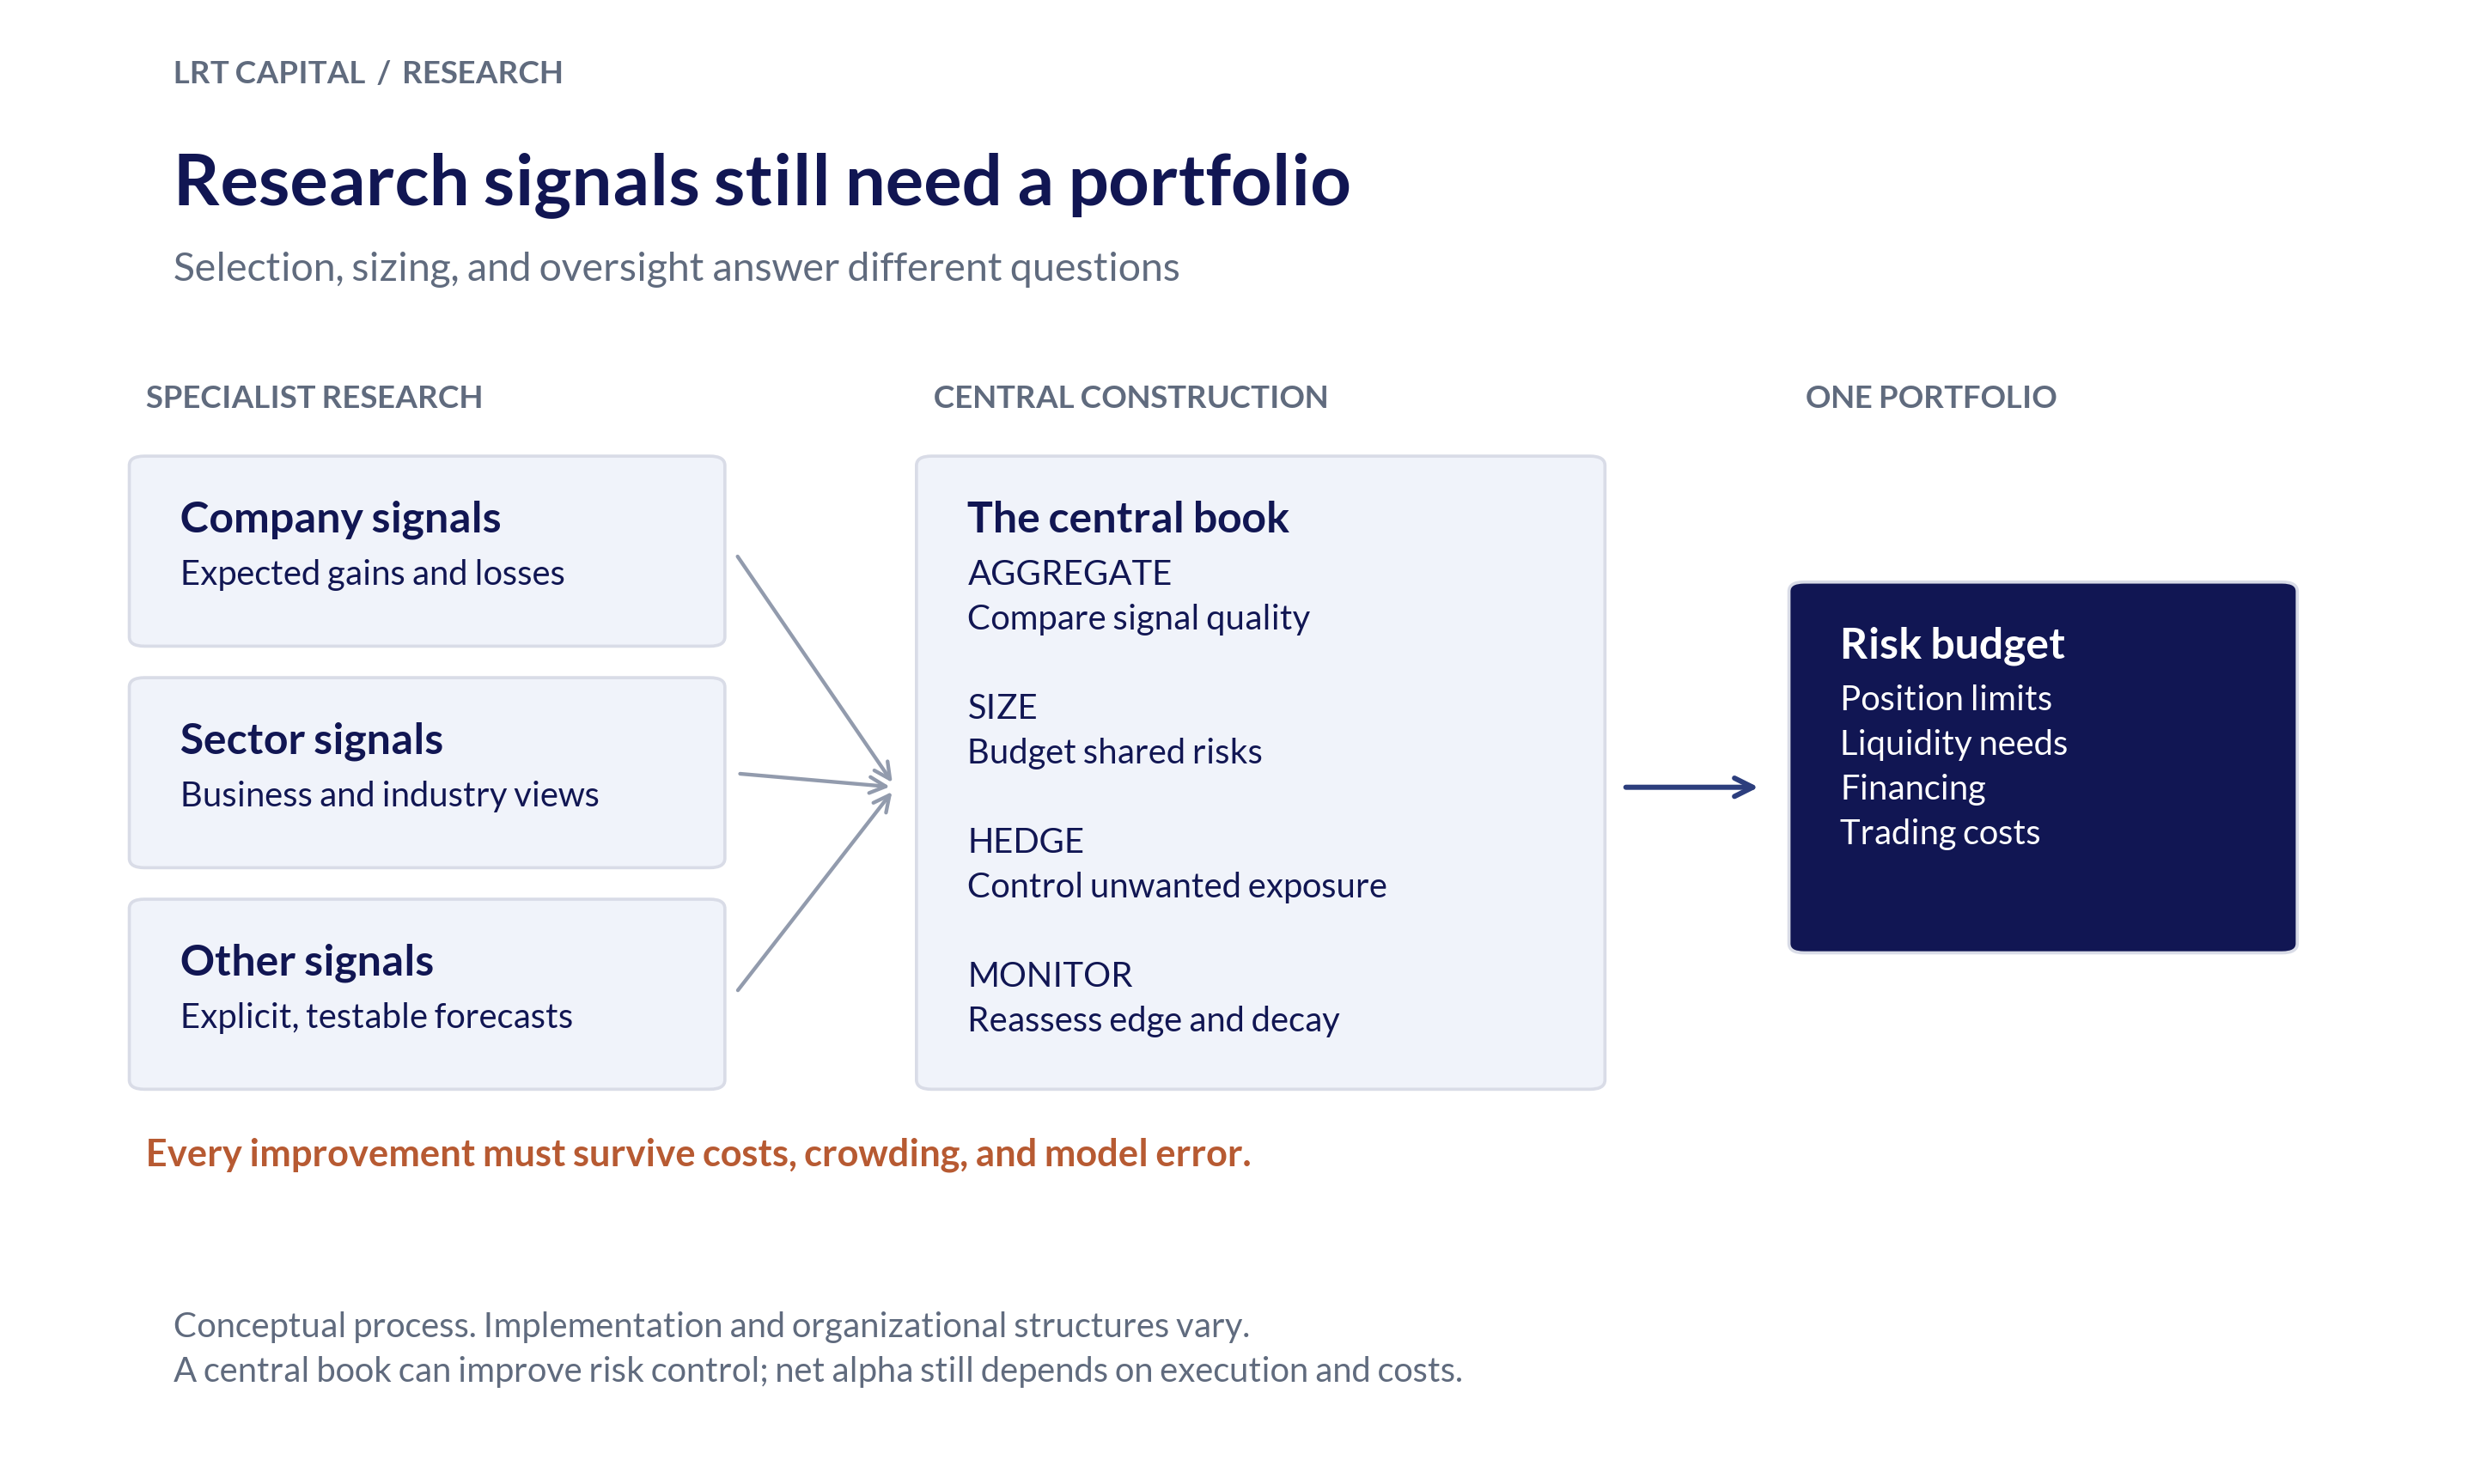
Individual pods, as discussed, have modest edges. Their alpha is constrained by the mathematics of small edges. But the central book operates at a different level. It has access to signals from dozens of pods, each with their own modest edges. The central book's job is to aggregate those signals, construct an optimal portfolio, manage correlations, apply hedges, and ultimately improve the risk-adjusted return profile beyond what any individual pod could deliver.
A useful framing: the central book's primary contribution is improving risk-adjusted returns through superior portfolio construction; whether this translates into incremental alpha after costs depends on execution quality and cost discipline. It is not magic. It is engineering, and badly-engineered central books can give back most of what well-engineered ones add.
Signal Aggregation and Diversification
When a central book aggregates signals from multiple pods, it gains advantages that individual pods cannot access.
First, diversification mathematics. If pods have uncorrelated edges, aggregating them reduces volatility while maintaining expected return. The benefit applies at the signal level rather than the security level, which is more powerful because signals can be combined across pods, weighted by quality, and rebalanced over time in ways individual securities cannot.
Second, signal weighting. Some pods have higher Sharpe ratios than others. Some have shown more stable edge over time. The central book can weight signals proportionally to demonstrated edge quality, concentrating more capital in pods with stronger, more stable signals while maintaining diversification across the full set.
If the central book can reliably identify which pods are truly generating alpha versus which are just lucky, signal weighting extracts meaningful additional return. The qualifier matters: identifying alpha versus luck is itself difficult, particularly at sample sizes available within a single platform over a few years. The central book's edge in signal weighting depends on how good its measurement and inference are—and many central books overestimate their ability to do this.
Correlation Management and Hedging
Individual pods typically operate sector-neutral or factor-neutral within their domain. But across pods, hidden correlations emerge. A healthcare pod and a consumer staples pod might both be implicitly long defensive factor exposure. A small-cap pod and a quality pod might both be implicitly short interest-rate sensitivity. Without active correlation management, the platform ends up with concentrated factor exposure that no individual pod intended.
The central book detects these correlations and applies hedges—index futures, sector indices, factor hedges—to neutralize unintended exposures. This reduces portfolio volatility and ensures that the realized risk profile matches what was intended.
Hedging also creates a natural risk circuit-breaker. If a pod's edge degrades or factor exposure shifts, the hedge automatically adjusts.
Optimal Position Sizing at the Portfolio Level
The third source of structural improvement is optimal sizing of individual positions drawn from pod signals. Even if each pod is equal-weighting its own positions, the central book does not have to equal-weight across all pods' positions. The central book solves an optimization problem: given all the signals from all pods, what portfolio maximizes risk-adjusted return subject to constraints—position caps, sector neutrality, factor neutrality, target volatility, target gross and net exposure?
This optimization can:
- Identify lower-ranked positions that improve overall portfolio Sharpe through diversification
- Manage marginal contribution to portfolio risk position-by-position
- Reweight dynamically as new signals arrive
This is genuinely valuable, but it is also genuinely costly. Frequent reoptimization generates turnover, and turnover generates transaction costs. The optimal frequency of rebalancing balances the benefit of incorporating new signals against the cost of trading. Get this balance wrong and the central book's optimization becomes a turnover machine that degrades returns.
Edge Decay Detection at Scale
The fourth function is systematic edge decay detection across the entire pod complex. As discussed in the pods section, this comes with false-positive risk—but the comparison is to a single manager with no monitoring at all, and on that comparison the central book wins.
The Central Book's Net Contribution
Taken together, these functions—signal aggregation, correlation management, optimal sizing, and decay detection—represent a distinct source of risk-adjusted return improvement separate from the pods themselves.
Whether this translates into net alpha depends on execution. A well-engineered central book that controls turnover, calibrates monitoring properly, manages costs, and avoids overfitting can add value over naive aggregation. The original paper's suggested 100 to 200 basis points annually is an illustrative possibility, not an estimated industry premium or a forecast. A poorly engineered central book can give its gross benefit back through cost drag, false-precision monitoring, and overactive rebalancing.
The implication for investors evaluating pod shops: do not just look at pod quality. Look at the central book. Who is running it? What is the turnover? How is monitoring calibrated? What are the all-in costs? These questions matter as much as pod quality itself.
Synthesis: Edge, Organization, and Compounding
The through-line connecting all of this is a simple observation: most investors, including most professional investors, mis-size modest edges as if they were large ones.
A fundamental manager can have a genuine but modest advantage. The paper uses win probabilities around 52 to 53 percent as an illustration, not a conversion from information ratios or an industry estimate. The point is the mismatch between a modest estimated edge and a portfolio built as though the edge were enormous. Actual stock weights need a joint payoff and risk model; they cannot be backed out of the binary Kelly formula.
Overbetting works in bull markets and lucky streaks. Over time, it produces catastrophic drawdowns or slow decay into mediocrity as luck regresses to fundamental probabilities and concentrated positions experience inevitable idiosyncratic shocks.
The Buffett comparison helps clarify the questions rather than supply the answer. Was the opportunity unusually attractive? What did its downside look like? What capital supported it? His early partnership investments and Berkshire's later insurance-funded structure are distinct examples. Neither establishes a transferable position-size rule for a modern redeemable fund.
Concentrated high-conviction funds—the 20-stock products, the benchmark-constrained 8-name portfolios, the conviction-driven 10-stock strategies—represent the most explicit form of this overbetting failure. They violate sizing discipline by design. They produce spectacular results during favorable cycles, then collapse when cycles turn. The empirical record is unambiguous: prominent concentrated funds repeatedly grow to multi-billion AUM during good runs, then collapse to fractions of their former size when their edge proves insufficient. Their differentiated marketing narratives often turn out to be camouflage for correlated factor exposures rather than differentiated alpha. Different stories, same factor exposure.
Pod shops attack this through organizational separation: pods generate signals with modest edges, the central book aggregates and optimizes, and continuous monitoring detects decay. The structure makes overbetting institutionally difficult—though not impossible—and is genuinely better-disciplined than single-manager structures. It also introduces real costs, crowding risks, and overfitting risks that erode some of the theoretical advantage. The net benefit after frictions is smaller than the gross benefit on paper, but it is still meaningful.
The pod shop is not the only structural answer. The same disciplines—separating selection from sizing, enforcing systematic position weights, monitoring for decay, applying hedges to neutralize unintended exposures—can be implemented in other organizational forms. What matters is not the particular structure but the underlying principles. Whatever the form, the winning approach internalizes that individual edges are modest and that systematic aggregation under discipline is what extracts alpha.
It is also worth noting that all structures are sensitive to regime. Concentrated funds outperform when their factor tilts are in favor and underperform when they are not. Pod shops perform best in environments where idiosyncratic alpha is available and worst when correlations spike and crowding bites. Some apparent structural superiority is regime-driven rather than purely structural, and any honest comparison has to account for the time period being measured.
The future of asset management likely belongs to organizations that embrace this discipline—whether through pod shops or other systematic structures. The winners will be those that honestly assess their edges, size positions accordingly, apply appropriate hedges, manage costs, and respond quickly to decay. Luck plays a role over any five-year period. Discipline compounds over decades.
Coda: The Industrial Era of Alpha
A useful metaphor for the transition this memo describes: alpha generation has gone the way of gold extraction.
In the popular imagination, gold mining still conjures the image of a lone prospector panning a Sierra Nevada riverbed in 1849—an artisanal figure whose individual skill, intuition, and luck might yield a fortune. That world is largely gone. Modern gold extraction is an industrial process: heavy machinery grinding through tons of ore, complex chemistry isolating microscopic particles, capital-intensive operations where the individual panner would yield essentially nothing. The romance is gone.
But here is the optimistic point: industrial extraction can recover material that an individual prospector could never reach economically. The process is different. The lone panner has been replaced by capital-intensive systems, but the resource has not disappeared.
Asset management is undergoing the same transition. The artisanal stock-picker—working from intuition, restaurant visits, and conversations with the local car mechanic—is increasingly anachronistic. The successful modern alpha extractors are industrial: they aggregate signals across many domains, apply systematic discipline that no individual human could maintain, run optimizers and hedges and decay detection at scale. The romance is gone, and the marketing narratives about lone-genius investors increasingly describe a world that no longer exists. But the alpha is real, and arguably more accessible to those willing to operate at industrial scale than it has ever been—just to a different kind of operator, with a different kind of process.
This is, in the end, a hopeful conclusion. The death of artisanal alpha is not the death of alpha. It is the rise of a different way of extracting it.
Most managers do not fail because they lack edge. They fail because they size as if their edge were much larger than it is. The dominant failure in investing is not lack of intelligence—it is mis-sizing modest edges as if they were large ones.
Appendix: A Diagnostic for Allocators
Questions to ask a fundamental manager—and what the answers reveal.
On sizing discipline
- What is your largest position size, and what expected payoff and portfolio risk justify it? Ask how the manager allows for uncertainty, correlation, liquidity, and the cost of being wrong. Fractional Kelly can inform that discussion, but a stock weight does not imply a unique win probability.
- What are the average and median position sizes in your portfolio? Headline concentration ("top ten holdings") often understates the actual sizing profile. The full distribution tells you what is really going on.
- How do you decide how much to size a new position? Listen for "conviction" without quantitative grounding versus a structured framework. Conviction-based sizing is overbetting by construction.
On bundling and confounded edges
- Of your top five positions, how many are also expressions of a sector or macro view? If most of them are, the manager is bundling. The joint probability of all those views being right simultaneously is much lower than the position size implies.
- How would you express a high-conviction macro or sector view? If the answer is "through individual stock selection," the manager has no clean way to separate idiosyncratic alpha from macro and sector bets. They are running implicit leverage they have not priced.
On factor exposure
- What is your portfolio's correlation to the closest five to ten managers in your category over the last three to five years? High correlations are a reason to investigate common factors; they do not establish the absence of alpha on their own.
- What factor exposures (quality, value, momentum, growth, size) is your portfolio currently running, and are they intentional? Many managers cannot answer this with precision. The ones who cannot are running implicit factor bets they have not measured.
On edge decay and process drift
- What metrics would tell you that your process has stopped working, and how quickly would you act? Vague answers ("we would review the strategy") suggest no real circuit-breaker exists.
- How has your stated process evolved over the last five to ten years? Process drift is one of the largest hidden risks. Look for honest acknowledgment of evolution rather than claims of consistent application of a static framework. A manager whose 2024 portfolio looks nothing like their 2014 portfolio—but who insists the process is unchanged—is rationalizing.
On the bankroll question
- What is your fund's redemption profile, and how does it shape your sizing? A manager running concentrated positions on quarterly-redemption capital has structurally different risk than one operating on permanent capital. The Buffett comparison breaks down on this dimension alone, and most managers do not acknowledge it.
Summary
If a manager cannot answer most of these questions clearly, or if the answers reveal conviction-based sizing, unmeasured factor exposure, no decay detection, and bundled edges, you are looking at the structural pattern this memo describes. That pattern can produce excellent returns during favorable cycles. It tends to produce catastrophic results across full cycles.
Lukasz Tomicki is the founder and portfolio manager of LRT Capital Management, a long/short equity hedge fund based in Austin, Texas. He teaches finance at the University of Texas at Austin's McCombs School of Business and is a regular commentator on Bloomberg and Schwab Network.
About this web edition and the graphics
This web edition retains the original 21-page paper's six-part argument, coda, and allocator diagnostic. Layout, section labels, and selected mathematical and historical explanations have been edited for the web. In particular, binary betting stakes are distinguished from stock weights; joint-condition probabilities are distinguished from investment payoffs; and Buffett's partnership investment is distinguished from Berkshire's later insurance float. Anonymous fund anecdotes and unsourced industry ranges are not presented as a new empirical study.
The four graphics were created for this edition. The Kelly curve uses expected log growth g(f) = p × ln(1 + f) + (1 − p) × ln(1 − f), with p = 0.52. The conjunction graphic uses independent conditions with probability 0.55 each. The diversification curve uses equal weights, equal volatility, and one common pairwise correlation. The central-book diagram is conceptual. Download the illustration calculations (CSV).
Further reading: J. L. Kelly Jr., A New Interpretation of Information Rate (1956); Berkshire Hathaway, 1994 shareholder letter; Berkshire Hathaway, 2014 shareholder letter.